

 SkillClick
Xylene Price Analysis 2026: Trend, Market Shifts and Outlook
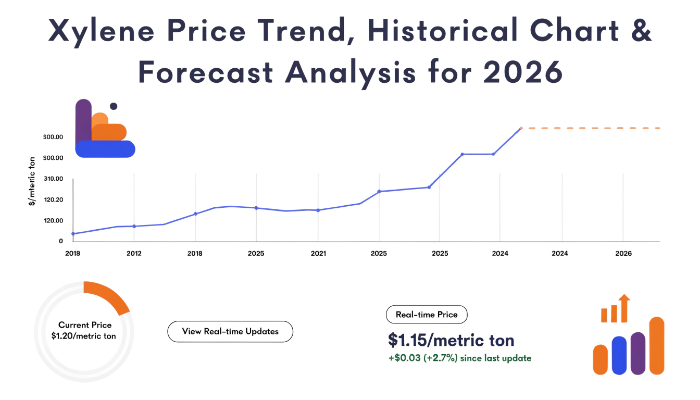
Global Xylene Price Trends & Updates – Q2 2026
Xylene Price Analysis 2026 shows a wide regional price range, with reported quotations from USD 706/MT in China to USD 1159/MT in Germany. The market remained influenced by feedstock costs, petrochemical operating rates, downstream demand, and regional trade flows. The Xylene Price Trend provides a useful benchmark for procurement teams evaluating regional purchasing costs.
IMARC Group’s Q2 2026 price-tracking database and methodology places the USA at USD 1060/MT, while South Korea and Japan were assessed at USD 957/MT and USD 952/MT, respectively. A verified Q2 quarter-on-quarter percentage change cannot be stated because the supplied dataset does not include comparable Q1 2026 prices. The regional spread nevertheless highlights meaningful differences in supply availability, production economics, and delivered costs.
Xylene Price Snapshot Q2 2026: Regional Benchmarks
- USA: USD 1060/MT
- China: USD 706/MT
- Germany: USD 1159/MT
- South Korea: USD 957/MT
- Japan: USD 952/MT
The Q2 2026 spread between Germany and China reached USD 453/MT, indicating substantial regional differences in xylene procurement economics. Germany recorded the highest supplied price at USD 1159/MT, followed by the USA at USD 1060/MT. South Korea and Japan remained close at USD 957/MT and USD 952/MT, while China recorded the lowest benchmark. The variation reflects differences in feedstock costs, production availability, downstream demand, freight, and regional trade flows.
Q2 2026 Xylene Price Analysis: Regional Market Conditions
North America Xylene Prices: USA
The USA recorded USD 1060/MT in Q2 2026. Its position above the Asian benchmarks supplied for China, Japan, and South Korea indicates a comparatively higher regional procurement level. Demand from solvents, coatings, plastics, and other downstream applications can influence buying requirements, while refinery and petrochemical operating rates affect availability.
Asia-Pacific Xylene Prices: China, Japan and South Korea
China recorded USD 706/MT, the lowest supplied Q2 benchmark. Japan stood at USD 952/MT, while South Korea reached USD 957/MT. The substantial gap between China and the other Asian markets indicates different supply-demand balances and delivered-cost structures across the region. India was included in the requested regional grouping, but no verified Q2 2026 India price was supplied, so no value is estimated.
South America Xylene Prices: Brazil
Brazil was specified in the requested regional grouping, but no verified Q2 2026 Brazil price was provided. Therefore, a country-level quotation or trend direction is not estimated. Brazil's position should be assessed separately once a verified benchmark becomes available.
Germany Xylene Price Benchmark: Q2 2026
Germany recorded USD 1159/MT, the highest price among the five supplied markets. Although Europe was not included as a requested country-analysis region, this verified figure remains part of the Q2 regional snapshot and demonstrates the wide global pricing differential.
Xylene Supply and Demand Overview – Q2 2026
Xylene pricing is closely connected to refinery operations, aromatic production, feedstock availability, and downstream consumption. Demand from polyester, plastics, solvents, coatings, and chemical manufacturing can influence purchasing requirements. On the supply side, plant operating rates, maintenance shutdowns, inventory levels, and regional trade flows can affect availability. Freight costs also influence delivered prices, particularly for import-dependent buyers. The Q2 data shows that these factors produced significantly different regional benchmarks, making local supply-demand conditions important for procurement decisions.
Xylene Price Trend 2026: Quarterly Index and Historical Analysis
The Xylene Price Trend in Q2 2026 is best interpreted through the regional spread because comparable Q1 2026 prices were not included in the supplied dataset. The reported Q2 benchmarks ranged from USD 706/MT in China to USD 1159/MT in Germany, creating a USD 453/MT difference. A precise quarter-on-quarter increase or decrease cannot be calculated without verified Q1 values. The Xylene price history chart should therefore use comparable historical quarterly observations when evaluating actual index movement rather than inferring changes from the current regional snapshot.
Xylene Price Forecast 2026: Next 12 Months
The Xylene price forecast 2026 will depend on crude oil and feedstock costs, refinery utilization, aromatics production, downstream demand, inventories, and international trade flows. Strong polyester and chemical-sector consumption could support purchasing requirements, while higher production availability or weaker downstream demand could place downward pressure on prices. Freight and regional supply disruptions may continue to create differences between domestic and import-based benchmarks. Procurement teams should track feedstock indicators alongside local supplier offers when planning medium-term contracts.
Key Factors Affecting Xylene Prices: Quarterly Perspective
Several factors can influence xylene prices from one quarter to another:
- Feedstock costs: Crude oil and naphtha movements influence aromatic production economics.
- Refinery operating rates: Changes in refinery utilization can affect xylene availability.
- Downstream demand: Polyester, plastics, solvents, coatings, and chemical production influence consumption.
- Plant maintenance: Planned or unexpected shutdowns can temporarily tighten supply.
- Inventories: Producer and buyer inventories can affect spot purchasing requirements.
- Freight costs: Shipping and inland logistics influence delivered prices across importing markets.
- Trade flows: Import demand, exports, tariffs, and regional arbitrage can alter market balances.
What Is Xylene and Why Is It Important?
Xylene is a group of aromatic hydrocarbons consisting of three structural isomers: ortho-xylene, meta-xylene, and para-xylene. It is produced primarily through petroleum refining and petrochemical processes and is widely used as a chemical intermediate and solvent. Para-xylene is particularly important for polyester and purified terephthalic acid production, while other xylene isomers are used in solvents, coatings, plastics, and chemical manufacturing.
Xylene Market Developments and Q2 2026 Highlights
The Q2 2026 data highlight a strongly differentiated global pricing structure. Germany recorded USD 1159/MT, while China stood at USD 706/MT, creating the widest gap among the supplied markets. The USA remained at USD 1060/MT, with Japan and South Korea close to USD 950/MT. For the next pricing cycle, buyers should monitor refinery utilization, aromatics production, downstream polyester demand, inventories, freight conditions, and regional trade movements. These factors can materially change local price relationships.
FAQs About Xylene Pricing Insights & Trend Analysis:
What was the Xylene Price in Q2 2026?
Q2 2026 xylene prices ranged from USD 706/MT in China to USD 1159/MT in Germany among the supplied markets. The USA was at USD 1060/MT, while South Korea and Japan were at USD 957/MT and USD 952/MT.
What does the Xylene Price Chart show for Q2 2026?
The Xylene Price Chart shows a USD 453/MT difference between the highest and lowest supplied benchmarks. This spread reflects differences in regional supply, downstream demand, feedstock economics, freight, and trade conditions.
What is the Xylene Price Trend expected to be in 2026?
The Xylene Price Trend will remain sensitive to crude oil and feedstock costs, refinery operating rates, downstream demand, inventories, and trade flows. Regional procurement prices may continue to differ significantly depending on local supply availability and logistics.
How IMARC Helps Track Xylene Prices
IMARC Group tracks xylene prices across key producing and consuming markets using structured price intelligence and regional benchmarking. Its Q2 2026 assessment highlights substantial differences between Asian, North American, and European benchmarks. The data helps procurement teams compare regional prices and monitor changes in supply, demand, feedstock costs, and logistics. Future pricing will depend on refinery operations, downstream consumption, inventories, and international trade conditions. IMARC Group’s ongoing price intelligence can support forward-looking procurement and supply-chain planning.
Explore real-time pricing intelligence and market insights: https://www.imarcgroup.com/pricing-intelligence
Contact Us:
IMARC Group
134 N 4th St., Brooklyn, NY 11249, USA
Email: sales[@]imarcgroup.com
Tel No:(D) +91 120 433 0800
United States: +1-201971-6302
- Managerial Effectiveness!
- Future and Predictions
- Motivatinal / Inspiring
- Fitness and Wellness
- Medical & Health
- Manufacturing
- Education
- Real-Estate
- Food Industry
- Hospitality
- Online Games
- Sports
- Home Services
- Civil Engineering
- Safety and Protection
- Software Products & Services
- Fashion and Jewellery
- Artificial Intelligence
- Entrepreneurship
- Mentoring & Guidance
- Marketing
- Networking
- HR & Recruiting
- Literature
- Shopping
- Career Management & Advancement