

 SkillClick
Chromium Prices Trend Analysis with Index and Quarterly Forecast Prices : Q2
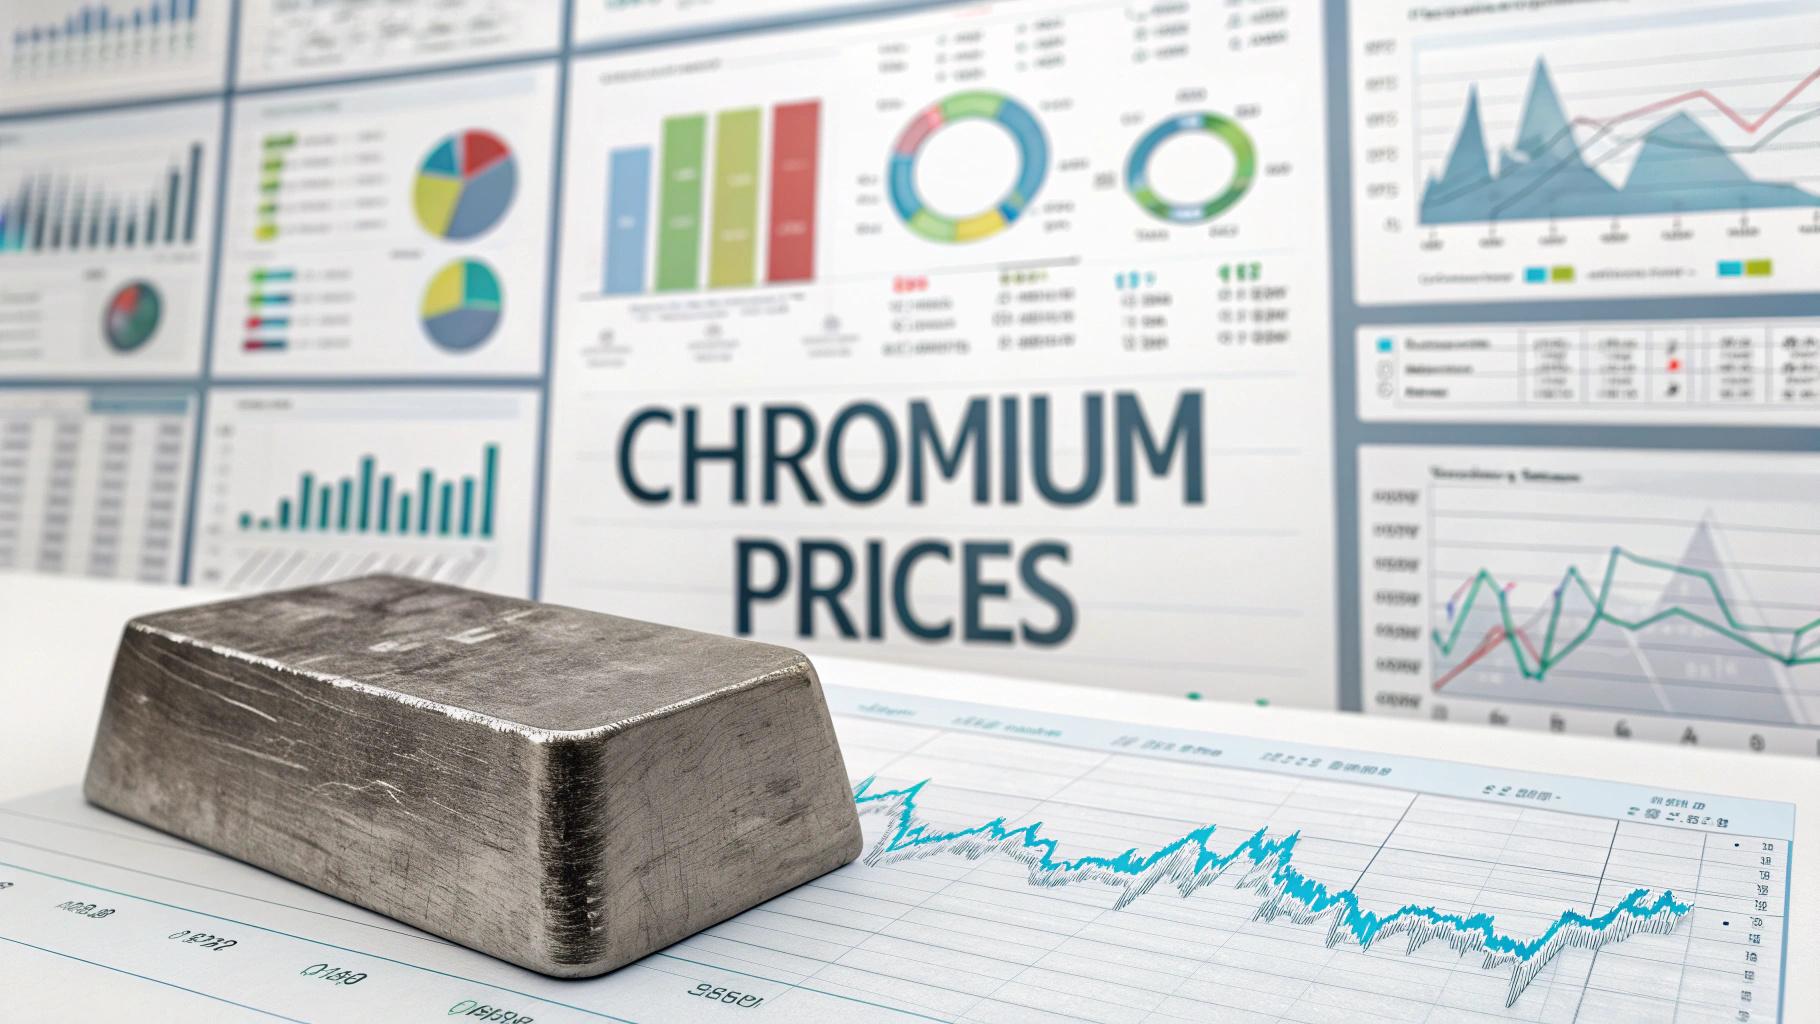
The Chromium Price Index remained firm across the major reported markets during Q2 2026, with prices ranging from USD 8,910/MT in China to USD 16,764/MT in Canada. The substantial regional spread reflected differences in chromium availability, ferrochrome and stainless steel production, import requirements, energy costs, and regional supply-chain conditions.
Canada recorded the highest benchmark at USD 16,764/MT, followed by the USA at USD 14,353/MT, Brazil at USD 10,801/MT, Japan at USD 10,695/MT, and China at USD 8,910/MT. Chromium demand remained closely connected to stainless steel, ferroalloys, engineering alloys, aerospace, automotive, construction, and industrial manufacturing. Stainless steel remains the dominant downstream application for ferrochrome, making chromium demand particularly sensitive to stainless steel production cycles.
Regional Chromium Prices Outlook – Q2 2026: Where Are Prices Highest?
Canada: USD 16,764/MT
USA: USD 14,353/MT
Brazil: USD 10,801/MT
Japan: USD 10,695/MT
China: USD 8,910/MT
The highest chromium price was recorded in Canada at USD 16,764/MT, while China recorded the lowest benchmark at USD 8,910/MT. The wide spread reflects differences in domestic availability, downstream steel requirements, import exposure, processing costs, and regional procurement structures.
The USA also maintained a relatively elevated benchmark at USD 14,353/MT, while Brazil and Japan remained close to the USD 11,000/MT level. China's lower reported price reflected its extensive ferroalloy and stainless steel production infrastructure and comparatively integrated regional supply chains.
Regional Price Analysis of Chromium Prices – Q2 2026
Canada
Canada recorded the highest chromium price at USD 16,764/MT during Q2 2026. The elevated benchmark reflected regional supply conditions, downstream alloy requirements, and the costs associated with securing chromium-containing raw materials.
Demand remained closely linked to stainless steel and specialty alloy production. Chromium's ability to improve corrosion resistance, hardness, and high-temperature performance makes it essential in demanding industrial applications.
The Canadian market also remained sensitive to transportation and sourcing costs. Changes in international availability and supplier offers can therefore have a meaningful impact on delivered chromium prices.
USA
The USA recorded chromium prices of USD 14,353/MT during Q2 2026. The market remained supported by requirements from stainless steel manufacturing, aerospace alloys, automotive components, and specialized industrial applications.
Demand from engineering and high-performance alloy producers provided an important consumption base. Chromium-containing materials also remained strategically relevant for applications requiring corrosion resistance and durability.
The US market was influenced by domestic industrial activity as well as international supply conditions. Import requirements and logistics costs remained important considerations for procurement managers.
Brazil
Brazil recorded chromium prices of USD 10,801/MT during Q2 2026. The market remained supported by industrial manufacturing and demand from steel and alloy-related applications.
The country's industrial base generated requirements for chromium-containing materials across metallurgy, engineering, automotive, and construction-related applications. Procurement conditions remained influenced by domestic availability and international supply flows.
Brazil's benchmark remained above Japan and China but below North American pricing, reflecting differences in sourcing and regional market economics.
Japan
Japan recorded chromium prices of USD 10,695/MT during Q2 2026. The market remained closely connected to its advanced stainless steel, automotive, machinery, and specialty alloy industries.
Demand for corrosion-resistant and high-performance materials supported chromium consumption. Japanese manufacturers also maintained strict requirements for material quality and supply consistency, which influenced purchasing decisions.
The relatively competitive benchmark reflected established industrial infrastructure and efficient supply-chain networks, although the market remained sensitive to imported raw material costs.
China
China recorded the lowest reported chromium price at USD 8,910/MT during Q2 2026. The comparatively lower benchmark reflected the country's extensive ferroalloy and stainless steel production ecosystem and established access to chromium-containing feedstocks.
Demand remained supported by stainless steel manufacturing, infrastructure, machinery, automotive production, and industrial equipment. Stainless steel production is the principal driver of ferrochrome consumption globally, reinforcing the importance of Chinese steel-sector activity for chromium demand.
China's large-scale processing capacity and integrated downstream industries supported relatively competitive pricing compared with the higher benchmarks reported in North America.
Supply and Demand Overview – Q2 2026
Global chromium supply remained closely connected to chromite mining, ferrochrome production, electricity availability, smelting capacity, and international trade flows. South Africa, Kazakhstan, India, and other producing regions remain important to the global chromium supply chain, while ferrochrome production and stainless steel manufacturing determine much of the downstream demand.
Demand dynamics remained steady across key downstream sectors:
Stainless Steel: Primary demand center for chromium-containing materials
Ferroalloys: Essential for alloying and steel production
Automotive: Demand for corrosion-resistant stainless and specialty components
Construction: Consumption through stainless steel and durable alloy products
Aerospace: High-performance chromium-containing alloys
Engineering & Machinery: Applications requiring strength, hardness, and corrosion resistance
The overall market remained structurally supported by stainless steel production. Global steel demand is projected to recover modestly in 2026, although regional performance remains uneven, creating differentiated demand conditions for chromium and ferrochrome.
Key Factors Affecting Prices – Quarterly Perspective
Several critical factors influenced chromium pricing during Q2 2026:
Raw Material Availability: Chromite ore availability and grade quality influenced ferrochrome production economics.
Downstream Demand: Stainless steel remained the principal driver, supported by automotive, construction, aerospace, and industrial applications.
Logistics: Bulk transportation, port operations, freight rates, and international cargo flows influenced delivered chromium costs.
Energy Costs: Ferrochrome smelting is energy intensive, making electricity availability and prices important production-cost variables.
Trade Dynamics: Export availability, import requirements, regional inventories, and international ferroalloy trade influenced pricing disparities.
Recent Developments (Q2 Highlights)
Canada recorded the highest reported chromium benchmark at USD 16,764/MT
The USA maintained a comparatively elevated price of USD 14,353/MT
Brazil and Japan recorded closely aligned benchmarks of USD 10,801/MT and USD 10,695/MT
China recorded the lowest reported price at USD 8,910/MT
Stainless steel remained the primary downstream demand driver
Ferrochrome supply conditions continued influencing chromium market economics
Energy and logistics costs remained important considerations for producers and buyers
These developments supported a firm chromium market during Q2 2026, while substantial regional price differences reflected variations in supply structures and downstream industrial requirements.
For detailed insights, charts, and forecasts, explore: https://www.imarcgroup.com/chromium-pricing-report/requestsample
Chromium Price Chart Analysis – Quarterly Movement
The Chromium Price Chart for Q2 2026 highlights a substantial regional pricing spread, with Canada recording the highest benchmark at USD 16,764/MT and China the lowest at USD 8,910/MT.
Key quarterly movements include:
Early Q2: Buyers maintained regular procurement while monitoring chromite availability, ferrochrome production, and stainless steel requirements.
Mid-Q2: Stainless steel and alloy demand continued supporting chromium procurement, while regional production economics influenced supplier pricing.
Late Q2: Regional price differences remained pronounced, with North American benchmarks retaining a premium over Asian markets.
The chart highlights the importance of regional supply conditions when evaluating chromium procurement costs. Buyers can use the price pattern to compare sourcing markets, negotiate supply agreements, and manage raw material budgets.
Chromium Price Index & Historical Analysis
The Chromium Price Index remained firm during Q2 2026, with reported prices ranging from USD 8,910/MT to USD 16,764/MT. The wide regional range reflected differences in production costs, availability, trade flows, and downstream demand.
Chromium pricing historically remains closely connected to chromite ore production and ferrochrome markets, with stainless steel production acting as the dominant demand driver. Changes in stainless steel output can therefore influence ferrochrome requirements and subsequently affect chromium-related procurement conditions.
The chromium price history chart demonstrates market sensitivity to:
Chromite ore production
Ferrochrome smelting capacity
Stainless steel production
Electricity and energy costs
International freight and logistics
Regional trade and inventory conditions
The Q2 2026 pricing structure demonstrates that regional sourcing remains a significant determinant of chromium costs. Markets with higher import and transportation exposure can maintain substantial premiums, while integrated production centers can offer more competitive benchmarks.
What Is Chromium?
Chromium is a hard, lustrous metallic element valued primarily for its corrosion resistance, hardness, and ability to improve the performance of alloys. It occurs naturally in chromite ores and is widely processed into ferrochrome for use in steelmaking.
Key applications include:
Stainless Steel: Main application, where chromium provides corrosion resistance
Ferroalloys: Used to improve hardness, strength, and durability
Aerospace: Applied in high-performance alloy systems
Automotive: Used in stainless and specialty alloy components
Construction: Supports durable stainless steel products and infrastructure
Industrial Machinery: Used in corrosion-resistant and wear-resistant materials
Chromium's ability to enhance corrosion resistance and high-temperature performance makes it strategically important across steelmaking and advanced alloy applications.
Chromium Price Forecast – Next 12 Months
The chromium price forecast for the next 12 months indicates a stable-to-firm outlook, with prices expected to remain closely linked to stainless steel production, ferrochrome supply, chromite availability, energy costs, and global industrial activity.
Key growth drivers include:
Recovery in global stainless steel production
Growth in automotive manufacturing
Infrastructure and construction activity
Demand for corrosion-resistant engineering materials
Aerospace and high-performance alloy requirements
Continued industrial machinery production
Potential risks include:
Higher chromite and ferrochrome production
Weakening stainless steel demand
Lower industrial activity
Reduced electricity and smelting costs
Improved regional supply availability
Overall, chromium prices are expected to remain stable-to-firm over the next 12 months, supported by stainless steel and specialty alloy demand. However, market direction will remain sensitive to ferrochrome production, chromite supply, energy economics, and regional steel-sector performance.
FAQs About Chromium Prices Insights & Market Analysis
What does the Chromium Price Index indicate in Q2 2026?
The Chromium Price Index indicates a firm and highly differentiated regional market, with Canada recording the highest benchmark at USD 16,764/MT and China the lowest at USD 8,910/MT. The spread reflects variations in supply, processing, trade, and downstream demand.
How does the Chromium Price Chart help procurement managers?
The Chromium Price Chart helps procurement managers compare regional benchmarks, monitor stainless steel and ferrochrome market conditions, evaluate sourcing costs, and identify suitable procurement opportunities.
What is the chromium price forecast for the next 12 months?
Chromium prices are expected to remain stable-to-firm, supported by stainless steel, automotive, construction, aerospace, and industrial alloy demand. Chromite availability, ferrochrome production, energy costs, and global trade flows will remain key price drivers.
How IMARC Pricing Database Can Help
The latest IMARC Group study, "Chromium Prices, Trend, Chart, Demand, Market Analysis, News, Historical and Forecast Data 2026 Edition," presents a detailed analysis of chromium price trends and global market dynamics. The study provides comprehensive price analysis covering regional movements, historical trends, supply-demand conditions, and factors influencing current and future chromium prices.
The analysis examines the relationship between raw material availability, chromite mining, ferrochrome production, stainless steel consumption, trade dynamics, logistics, energy costs, and broader market developments. By assessing these interconnected factors, the pricing analysis helps businesses understand market direction and make informed procurement, budgeting, sourcing, and supply-chain decisions.
About Us:
IMARC Group is a global management consulting firm that provides a comprehensive suite of services to support market entry and expansion efforts. The company offers detailed market assessments, feasibility studies, regulatory approvals and licensing support, and pricing analysis, including spot pricing and regional price trends. Its expertise spans demand-supply analysis alongside regional insights covering Asia-Pacific, Europe, North America, Latin America, and the Middle East and Africa. IMARC also specializes in competitive landscape evaluations, profiling key market players, and conducting research into market drivers, restraints, and opportunities. IMARC’s data-driven approach helps businesses navigate complex markets with precision and confidence.
Contact us:
IMARC Group
134 N 4th St. Brooklyn, NY 11249, USA
Email: sales@imarcgroup.com
Tel No: (D) +91 120 433 0800
United States: +1-201971-6302
- Managerial Effectiveness!
- Future and Predictions
- Motivatinal / Inspiring
- Fitness and Wellness
- Medical & Health
- Manufacturing
- Education
- Real-Estate
- Food Industry
- Hospitality
- Online Games
- Sports
- Home Services
- Civil Engineering
- Safety and Protection
- Software Products & Services
- Fashion and Jewellery
- Artificial Intelligence
- Entrepreneurship
- Mentoring & Guidance
- Marketing
- Networking
- HR & Recruiting
- Literature
- Shopping
- Career Management & Advancement