

 SkillClick
Graphite Prices 2026: Price Chart, Trends & Regional Data
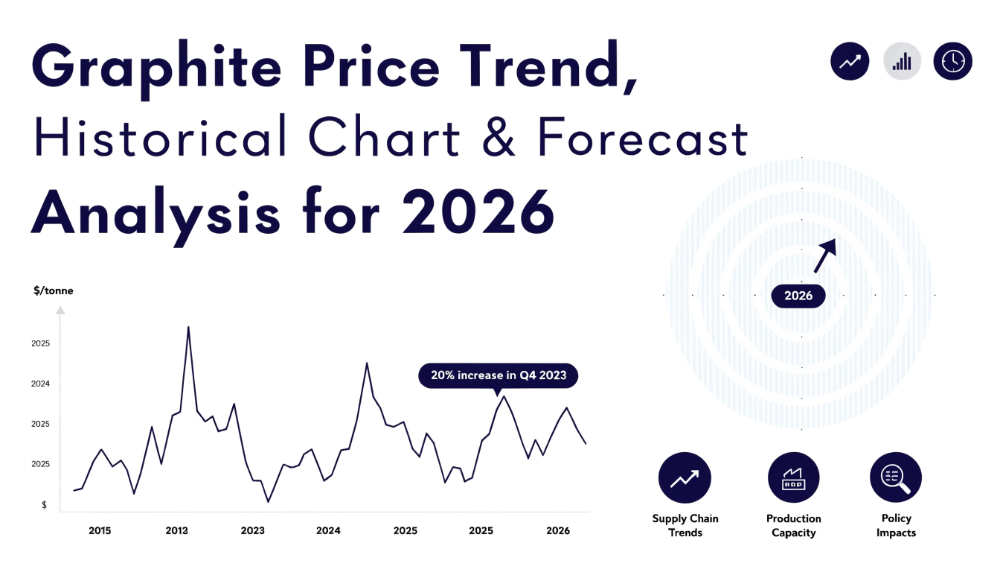
Global Graphite Price Trends & Updates – Q2 2026
Global Graphite Prices 2026 show a wide regional cost range, from USD 542/MT in China to USD 1,946/MT in Brazil. The verified Q2 dataset does not include Q1 benchmarks, so a precise quarterly percentage change or definitive uptrend/downtrend cannot be calculated without introducing unsupported data. The graphite price trend nevertheless shows pronounced geographic divergence. Buyers can review the Graphite Price Chart from IMARC Group for regional and historical pricing intelligence. IMARC Group’s Q2 2026 price-tracking database and methodology provide the benchmark framework used for this analysis.
The reported Q2 benchmarks were USD 852/MT in the USA, USD 803/MT in Germany, USD 1,453/MT in the United Kingdom, and USD 1,946/MT in Brazil. The USD 1,404/MT difference between Brazil and China highlights significant regional cost gaps that can affect sourcing strategies, delivered costs, and supplier negotiations.
Regional Graphite Prices Outlook Q2 2026
- USA: USD 852/MT
- China: USD 542/MT
- Germany: USD 803/MT
- Brazil: USD 1,946/MT
- United Kingdom: USD 1,453/MT
The Q2 benchmarks show substantial geographic dispersion, with China at the lowest reported level and Brazil at the highest. The USA and Germany remained relatively close at USD 852/MT and USD 803/MT, while the United Kingdom and Brazil carried significantly higher benchmarks. The spread may reflect differences in production economics, graphite availability, processing costs, logistics, trade exposure, energy expenses, and downstream demand.
Graphite Price Trend 2026: What Is Driving Regional Differences?
The Q2 data points to strong regional differentiation rather than a uniform global pricing structure. China’s USD 542/MT benchmark was considerably below the USA and Germany, while Brazil and the United Kingdom recorded substantially higher levels.
For procurement teams, the difference highlights the importance of assessing supplier location, product specification, processing requirements, freight, and trade conditions together. Battery materials, steelmaking, refractories, lubricants, and other industrial applications can also influence purchasing requirements and regional availability.
Q2 2026 Price Analysis: How Do Graphite Benchmarks Compare?
North America: What Was the USA Graphite Price?
The USA recorded USD 852/MT in Q2 2026. The benchmark places the country above China and Germany but well below Brazil and the United Kingdom. The supplied data does not contain Q1 values, so a verified directional quarterly change cannot be assigned.
Asia-Pacific: How Does China Compare With Other Regions?
China recorded USD 542/MT, the lowest benchmark in the dataset. The relatively low level may indicate comparatively favorable production and supply economics, although procurement costs also depend on graphite grade, processing, transportation, and end-use specifications.
South America: Why Was Brazil the Highest Benchmark?
Brazil recorded USD 1,946/MT, making it the highest-priced location in the supplied dataset. The premium versus China was USD 1,404/MT, indicating a significant regional cost differential that may reflect supply structure, processing economics, logistics, and domestic procurement conditions.
Europe: How Did Germany and the United Kingdom Compare?
Although Europe was not included in the requested regional grouping, the verified dataset contains two European benchmarks. Germany stood at USD 803/MT, while the United Kingdom reached USD 1,453/MT, creating a USD 650/MT difference between the two locations.
Supply and Demand Overview – Q2 2026
Graphite demand is strongly associated with steelmaking, refractories, foundry applications, lubricants, and battery-related value chains. Changes in industrial production and electric-vehicle battery activity can influence purchasing requirements for suitable graphite grades.
Supply conditions depend on mining output, processing capacity, flake availability, synthetic graphite production, inventories, plant utilization, and international trade flows. Regional differences in these factors can create substantial variations in procurement benchmarks.
Graphite Price Index & Historical Analysis: What Does Q2 2026 Show?
Graphite Price Index: How Should Buyers Interpret Q2 2026?
The Q2 regional benchmarks establish a broad reference range of USD 542–1,946/MT. However, the precise quarterly index movement cannot be calculated because the verified dataset does not provide Q1 index values.
For procurement analysis, the Q2 benchmark should be treated as a baseline for subsequent quarterly comparisons. Consistent product grades, specifications, locations, delivery terms, and measurement periods are essential when developing an internal purchasing index.
Graphite Price History Chart: What Should It Track?
A reliable historical series should compare equivalent graphite specifications across each reporting period. The Q2 2026 values provide a current reference point for tracking future changes in regional procurement costs and identifying persistent differences between producing and consuming locations.
Graphite Price Forecast 2026: What Could Happen Over the Next 12 Months?
Over the next 12 months, procurement costs are likely to remain sensitive to mining output, processing capacity, battery-material demand, steel production, energy expenses, freight, and international trade conditions. Stronger battery and industrial demand could place upward pressure on suitable graphite grades if supply does not expand at the same pace.
Conversely, increased production, improved inventories, softer freight costs, or weaker industrial consumption could moderate pricing pressure. Buyers should therefore evaluate regional supplier quotations alongside production and logistics indicators when developing purchasing budgets.
Key Factors Affecting Graphite Prices: Quarterly Procurement Perspective
- Battery demand: Growth in energy-storage and electric-vehicle supply chains can influence demand for suitable graphite.
- Steel production: Graphite electrodes and refractory applications connect consumption with steelmaking activity.
- Mining output: Changes in natural graphite production affect raw-material availability.
- Processing capacity: Purification, shaping, coating, and synthetic production capacity can influence supply.
- Energy costs: Electricity and other energy inputs are particularly relevant to processed and synthetic graphite.
- Freight: Transportation costs can materially affect delivered regional economics.
- Trade policies: Export restrictions, tariffs, and import requirements can alter regional supply balances.
- Inventory levels: Producer and consumer inventories can influence short-term purchasing requirements.
What Is Graphite and Why Does It Matter for Buyers?
Graphite is a crystalline form of carbon known for high-temperature stability, electrical conductivity, lubricity, and resistance to chemical attack. It is available in natural and synthetic forms and is used across steelmaking, refractories, batteries, lubricants, foundries, and other industrial applications.
For procurement teams, grade, purity, particle size, flake characteristics, processing level, delivery location, and supplier qualification are important factors when evaluating comparable offers.
Recent Graphite Developments in Q2 2026: What Should Buyers Monitor?
The verified Q2 dataset confirms substantial geographic pricing differences but does not provide specific, validated information on individual mine expansions, plant closures, supplier announcements, or trade-policy events. These developments therefore cannot be presented as confirmed Q2 highlights.
Procurement teams should monitor new mining and processing capacity, synthetic graphite operating rates, battery-sector demand, steel production, inventory changes, freight conditions, and international trade policies. These indicators can provide early signals for future regional pricing movements.
FAQs About Graphite Prices
What Were Graphite Prices in Q2 2026?
The reported Q2 2026 benchmarks ranged from USD 542/MT in China to USD 1,946/MT in Brazil. The USA, Germany, and United Kingdom were reported at USD 852/MT, USD 803/MT, and USD 1,453/MT, respectively.
What Does the Graphite Price Index Show for Q2 2026?
The Q2 benchmark range shows substantial regional dispersion, with a USD 1,404/MT difference between China and Brazil. A quarter-on-quarter percentage change cannot be calculated reliably because the verified dataset does not include Q1 index values.
Where Can Buyers Find the Graphite Price Chart?
The Graphite Price Chart provides a useful framework for comparing regional benchmarks and historical movements across consistent specifications. IMARC Group’s pricing intelligence can help procurement teams evaluate regional cost differences and support budgeting and sourcing decisions.
How IMARC Group Helps Procurement Teams Track Graphite Costs
IMARC Group provides pricing intelligence for procurement managers, buyers, and analysts evaluating regional and historical commodity costs. The Q2 2026 benchmarks show a substantial geographic spread, with China at USD 542/MT and Brazil at USD 1,946/MT.
Germany and the USA occupied the lower-middle range, while the United Kingdom recorded a higher benchmark. Looking ahead, mining output, processing capacity, battery demand, steel production, energy, freight, and trade conditions will remain important variables for quarterly procurement planning.
Explore pricing coverage across 500+ commodities: https://www.imarcgroup.com/pricing-intelligence
Contact Us:
IMARC Group
134 N 4th St., Brooklyn, NY 11249, USA
Email: sales[@]imarcgroup.com
Tel No:(D) +91 120 433 0800
United States: +1-201971-6302
- Managerial Effectiveness!
- Future and Predictions
- Motivatinal / Inspiring
- Fitness and Wellness
- Medical & Health
- Manufacturing
- Education
- Real-Estate
- Food Industry
- Hospitality
- Online Games
- Sports
- Home Services
- Civil Engineering
- Safety and Protection
- Software Products & Services
- Fashion and Jewellery
- Artificial Intelligence
- Entrepreneurship
- Mentoring & Guidance
- Marketing
- Networking
- HR & Recruiting
- Literature
- Shopping
- Career Management & Advancement