

 SkillClick
Petroleum Coke Prices Index and Trend Chart with Quarterly Forecast Prices
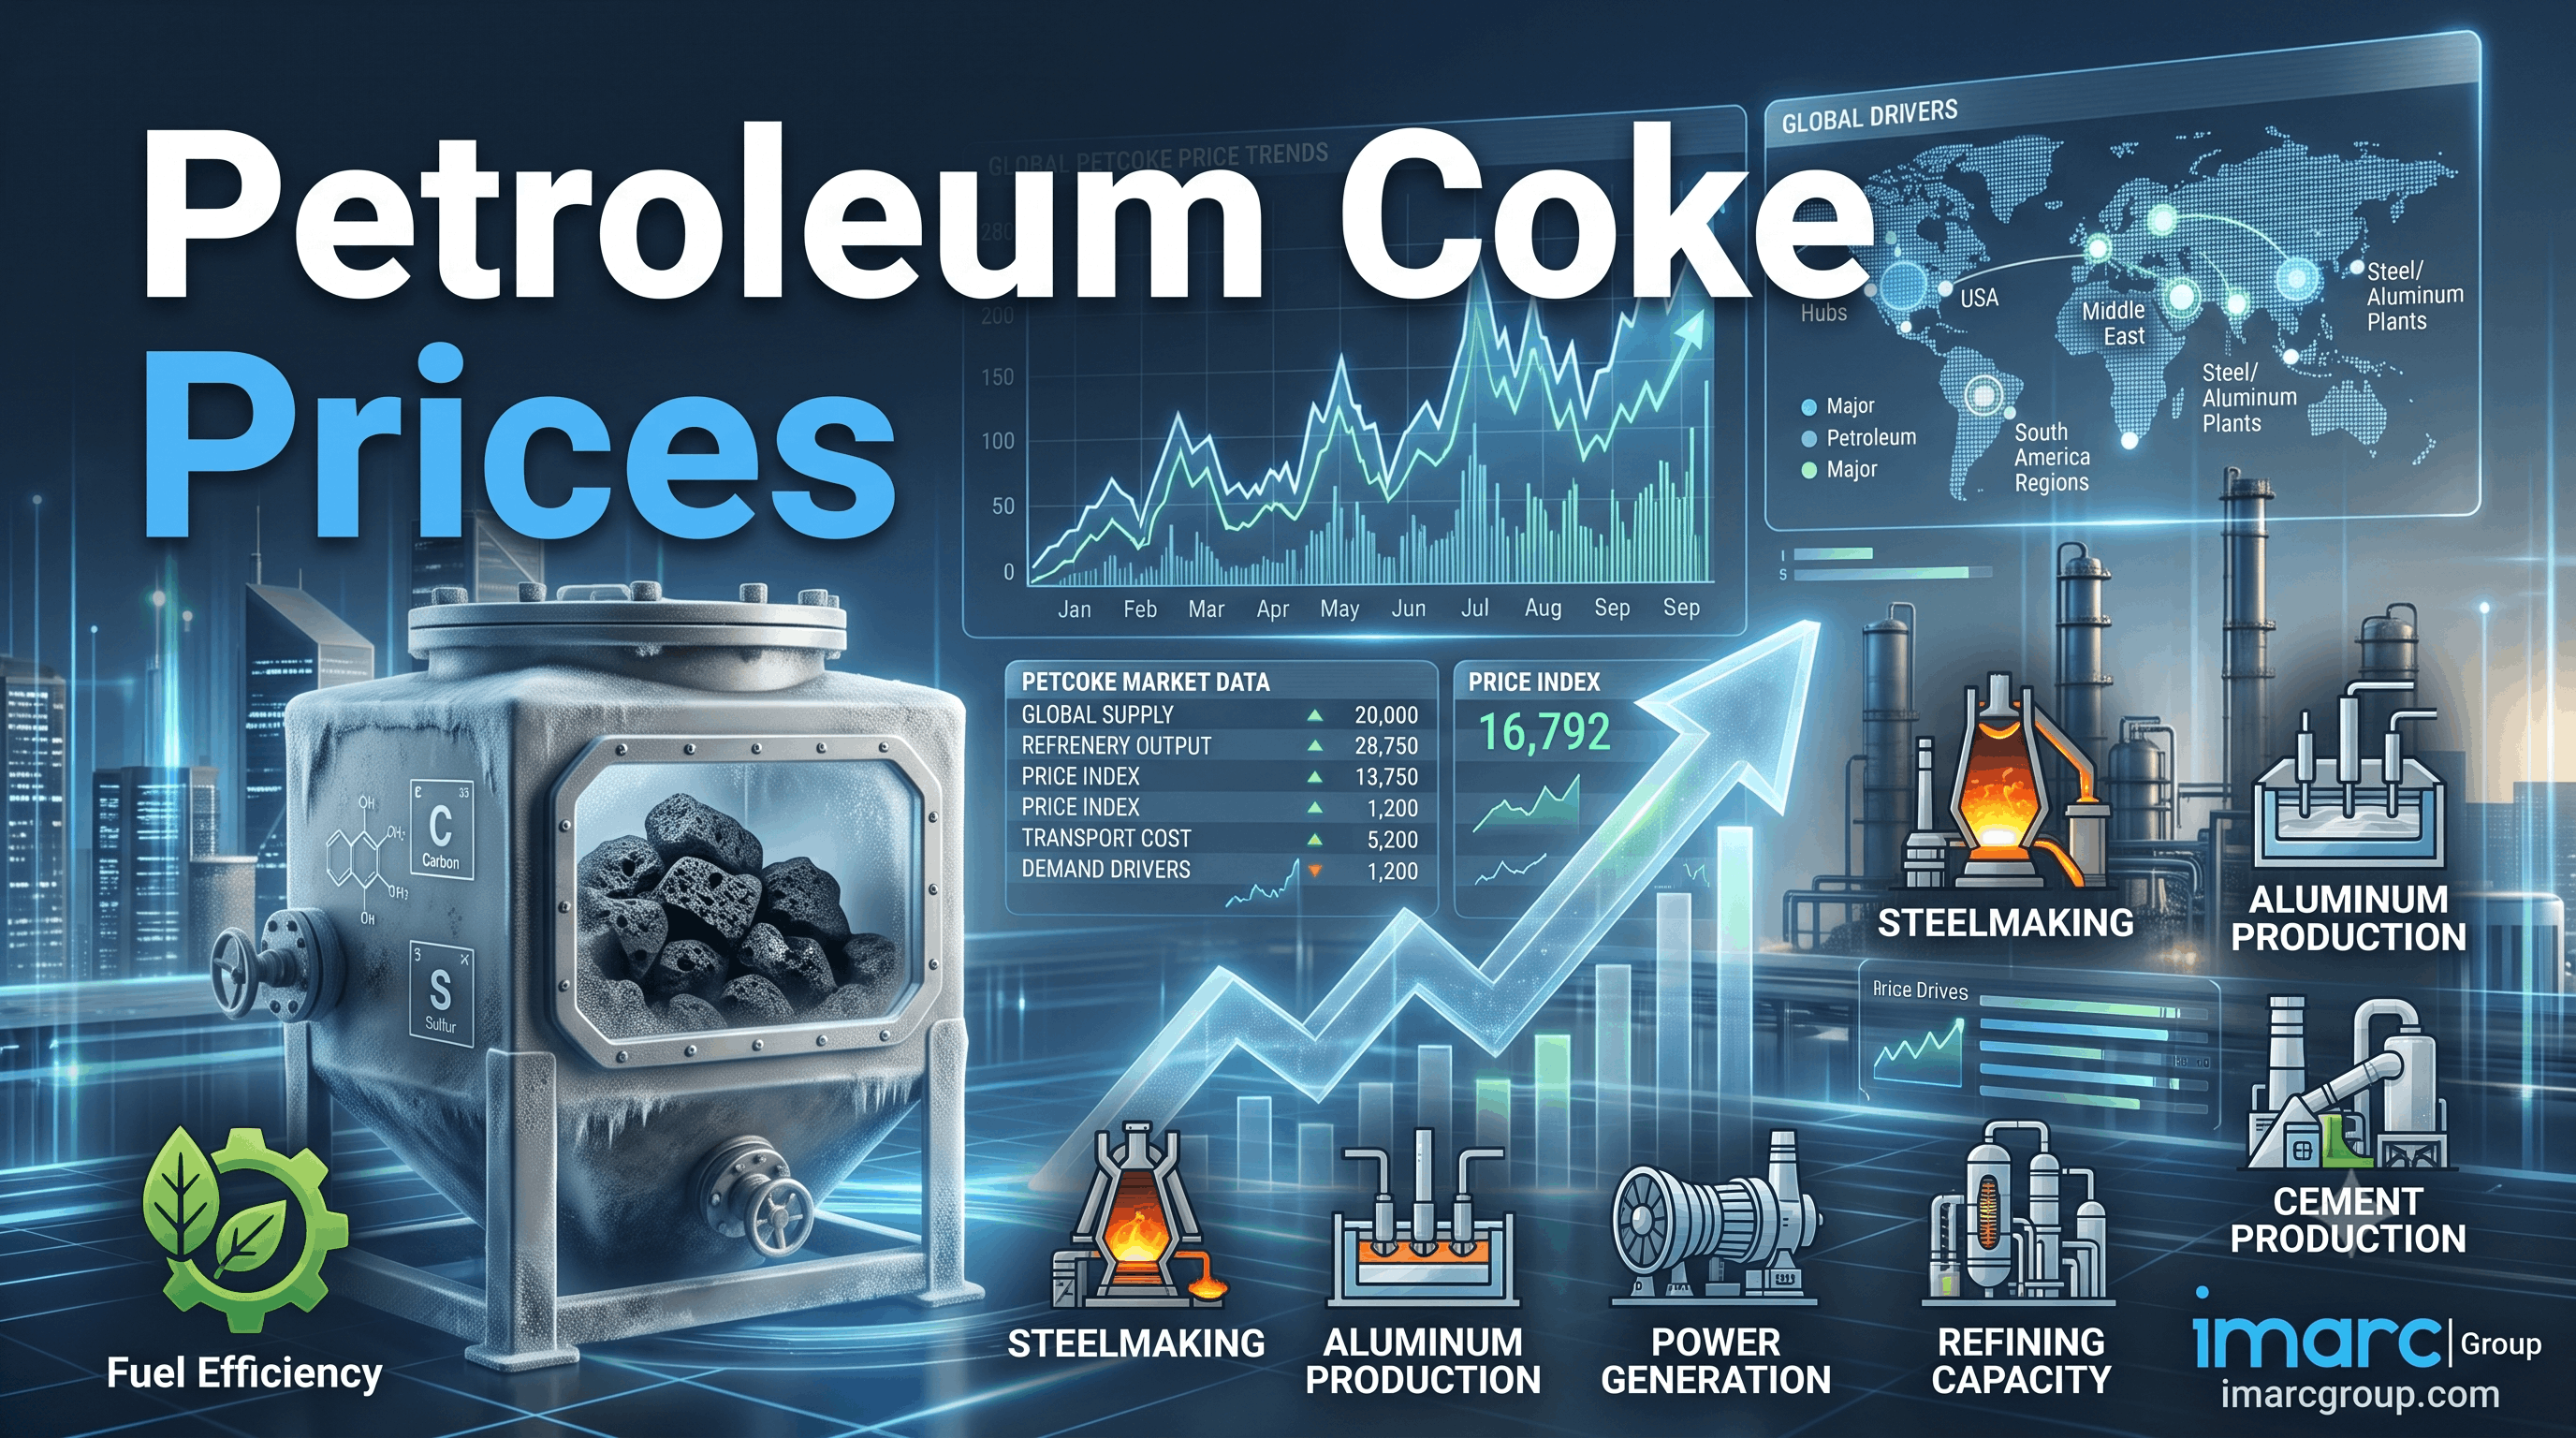
Petroleum coke prices remained significantly differentiated across major markets during Q2 2026, ranging from USD 187/MT in India to USD 638/MT in South Korea. The wide regional spread reflected differences in refinery output, petroleum coke quality, import dependence, freight costs, inventory positions, and demand from energy-intensive industries. South Korea recorded the highest price, while India maintained the lowest level among the tracked markets.
Demand remained closely connected to cement production, aluminum smelting, power generation, steel manufacturing, and other industrial applications where petroleum coke is used as a fuel or carbon source. Regional procurement strategies continued to respond to refinery operating rates, international trade flows, and transportation economics. Overall, Q2 2026 reflected a highly differentiated petroleum coke market, with local supply availability and downstream industrial demand shaping regional price formation.
Regional Petroleum Coke Prices Outlook – Q2 2026: Where Are Prices Highest?
South Korea: USD 638/MT
Brazil: USD 475/MT
USA: USD 405/MT
China: USD 367/MT
India: USD 187/MT
South Korea recorded the highest petroleum coke price at USD 638/MT, significantly above the other tracked markets. The premium reflected import requirements, freight exposure, product specifications, and strong industrial demand. Brazil followed at USD 475/MT, while the USA and China recorded USD 405/MT and USD 367/MT, respectively.
India recorded the lowest price at USD 187/MT, reflecting comparatively favorable domestic supply conditions and access to petroleum coke generated by domestic refining operations. The substantial regional spread highlights the influence of refinery configurations, quality specifications, transportation costs, and downstream consumption patterns on petroleum coke pricing.
Regional Price Analysis of Petroleum Coke Prices – Q2 2026
South Korea
South Korea recorded petroleum coke prices of USD 638/MT, making it the highest-priced market during Q2 2026. The elevated level reflected the country's exposure to international supply conditions, freight expenses, and demand from energy-intensive industrial consumers.
Cement, power generation, aluminum, and other industrial applications provided a stable demand base. Buyers continued to prioritize reliable supply and appropriate sulfur and quality specifications, while import costs remained an important component of delivered pricing. Inventory management also influenced procurement activity as consumers sought to maintain sufficient stocks for continuous operations.
Brazil
Brazil recorded petroleum coke prices of USD 475/MT during Q2 2026. The market remained supported by industrial demand from cement manufacturing, aluminum processing, and other energy-intensive applications. Regional transportation and import economics continued to influence delivered prices.
Cement producers maintained consistent fuel requirements, while other industrial consumers evaluated petroleum coke against competing energy sources. Buyers remained attentive to quality specifications, refinery supply, and logistics costs when determining procurement volumes.
USA
The USA recorded petroleum coke prices of USD 405/MT in Q2 2026. The market benefited from established refining infrastructure and consistent petroleum coke generation, while downstream demand remained linked to cement, power, aluminum, and industrial applications.
Regional availability varied according to refinery operating conditions and product specifications. Buyers continued to assess sulfur content, quality, transportation costs, and inventory levels when selecting material. Stable industrial consumption provided underlying support for the market.
China
China recorded petroleum coke prices of USD 367/MT during Q2 2026. Demand remained connected to cement, aluminum, steel, and other energy-intensive industries. The country's large industrial base provided a substantial consumption market, while domestic refining activity contributed to supply availability.
Procurement conditions remained influenced by refinery production, inventory positions, and downstream operating rates. Buyers continued to monitor the relative economics of petroleum coke against alternative fuels and carbon materials, keeping purchasing decisions closely tied to broader industrial conditions.
India
India recorded the lowest tracked petroleum coke price at USD 187/MT during Q2 2026. The comparatively low price reflected domestic refinery supply, established industrial consumption networks, and access to petroleum coke for major downstream users.
Cement manufacturing represented an important source of demand, alongside aluminum, power generation, and other industrial applications. Buyers benefited from relatively competitive domestic availability, although transportation distances and regional supply balances continued to influence delivered costs.
Supply and Demand Overview – Q2 2026
Global petroleum coke supply during Q2 2026 remained closely connected to refinery operating rates and crude-oil processing configurations. Refinery output determined the quantity and quality of petroleum coke available for industrial consumers, while international trade flows helped balance regional supply differences.
Demand dynamics remained steady across key downstream industries:
Cement Manufacturing: Strong consumption as a high-energy fuel in clinker production.
Aluminum Smelting: Continued use as a carbon source in anode manufacturing.
Power Generation: Demand from industrial and utility applications using petroleum coke as fuel.
Steel Production: Supporting demand from selected metallurgical and carbon-intensive processes.
Industrial Fuel: Consumption across energy-intensive manufacturing operations.
Carbon Products: Use in applications requiring carbon-rich feedstock.
The supply-demand balance varied substantially between regions. Markets with significant domestic refining capacity benefited from greater supply accessibility, while import-dependent consumers faced higher delivered costs due to freight and handling expenses.
Key Factors Affecting Prices – Quarterly Perspective
Several important factors influenced petroleum coke pricing during Q2 2026:
Refinery Output: Changes in refinery utilization directly affected petroleum coke generation and regional availability.
Downstream Demand: Cement, aluminum, power generation, and industrial fuel consumption supported market demand.
Logistics: Ocean freight, port handling, inland transportation, and storage expenses influenced delivered prices.
Energy Costs: Changes in competing fuel prices affected the relative attractiveness of petroleum coke for industrial consumers.
Global Trade Dynamics: Import requirements, export availability, and international trade routes shaped regional price differences.
Recent Developments (Q2 Highlights)
Refinery operating rates continued influencing regional petroleum coke availability.
Cement manufacturers maintained steady requirements for high-energy industrial fuels.
Aluminum producers continued purchasing petroleum coke for carbon-anode applications.
Import-dependent markets remained sensitive to freight and international supply conditions.
These developments reinforced the substantial regional pricing differences observed during Q2 2026.
For detailed insights, charts, and forecasts, explore: https://www.imarcgroup.com/petroleum-coke-pricing-report/requestsample
Petroleum Coke Price Chart Analysis – Quarterly Movement
The Petroleum Coke Price Chart for Q2 2026 highlights a substantial regional price range of USD 451/MT, between South Korea at USD 638/MT and India at USD 187/MT. South Korea maintained the highest price, while India recorded a considerably lower market value due to its domestic supply structure.
Key quarterly movements include:
Early Q2: Buyers maintained procurement according to refinery availability, industrial operating rates, and existing inventory levels.
Mid-Q2: Market participants monitored refinery output, international freight, and demand from cement and aluminum producers.
Late Q2: Regional price differences remained pronounced as supply accessibility and delivered logistics costs continued to influence procurement economics.
The quarterly chart demonstrates the strong impact of regional supply structures on petroleum coke prices. Procurement managers can use the price comparison to evaluate sourcing options, monitor delivered costs, and optimize inventory planning.
Petroleum Coke Price Index & Historical Analysis
The Petroleum Coke Price Index during Q2 2026 reflected a strongly differentiated global market, with prices ranging from USD 187/MT to USD 638/MT. The substantial gap was driven by differences in refinery supply, product quality, import dependency, freight costs, and industrial demand.
Historically, petroleum coke prices have been closely associated with crude-oil processing activity, refinery configurations, fuel-market conditions, and demand from cement and aluminum industries. Changes in refinery operating rates can alter petroleum coke availability, while fluctuations in energy markets can change its attractiveness relative to alternative fuels.
The petroleum coke price history reflects cyclical behavior influenced by:
Refinery utilization and petroleum coke generation
Cement, aluminum, and industrial fuel demand
Energy prices, freight, and international trade
Compared with markets with strong domestic refinery integration, import-dependent regions can experience significantly higher delivered prices. Q2 2026 demonstrated the continued importance of regional supply accessibility in determining petroleum coke market values.
What Is Petroleum Coke?
Petroleum coke, commonly known as petcoke, is a carbon-rich solid material produced as a by-product of petroleum refining. It is generated during the processing of heavier crude-oil fractions and is classified according to characteristics such as sulfur content, volatile matter, metals, and calorific value.
Key applications include:
Cement Manufacturing: Used as a high-energy fuel in cement kilns.
Aluminum Production: Used as a carbon source for manufacturing anodes.
Power Generation: Utilized as an industrial fuel where appropriate.
Steel and Metallurgy: Applied in selected carbon-intensive processes.
Industrial Fuel: Supports energy requirements in various heavy industries.
Carbon Materials: Used as a feedstock in selected carbon-based applications.
Its high carbon content and energy value make petroleum coke an important industrial fuel and carbon material across several heavy manufacturing sectors.
Petroleum Coke Price Forecast – Next 12 Months
The petroleum coke price forecast for the next 12 months points toward a stable-to-firm outlook with substantial regional variation. Demand from cement, aluminum, and other energy-intensive industries is expected to remain supportive, while refinery output and international trade flows will determine the availability of material across consuming markets.
Key growth drivers include:
Continued cement production and infrastructure development.
Stable aluminum smelting and anode manufacturing requirements.
Ongoing industrial fuel consumption.
Growth in energy-intensive manufacturing activities.
Continued demand for carbon-rich industrial materials.
Potential risks include:
Increased refinery output generating additional petroleum coke supply.
Weakness in cement and aluminum production.
Lower prices for competing industrial fuels.
Changes in environmental regulations affecting petroleum coke consumption.
Freight disruptions or trade restrictions affecting international supply.
Overall, petroleum coke prices are expected to remain supported by steady industrial demand, although regional pricing will continue to depend heavily on refinery availability, product specifications, logistics, and import requirements.
FAQs About Petroleum Coke Prices Insights & Market Analysis
What does the Petroleum Coke Price Index indicate in Q2 2026?
The Petroleum Coke Price Index indicates a strongly differentiated market, with prices ranging from USD 187/MT in India to USD 638/MT in South Korea. Refinery output, industrial demand, logistics, and import dependency remain key pricing factors.
How does the Petroleum Coke Price Chart help procurement managers?
The Petroleum Coke Price Chart helps procurement managers compare regional price levels, evaluate refinery supply conditions, monitor industrial demand, and assess sourcing and inventory strategies.
What is the petroleum coke price forecast for the next 12 months?
Petroleum coke prices are expected to remain stable to firm, supported by cement, aluminum, power, and industrial demand. Refinery output, competing fuel prices, environmental policies, and international logistics could create regional fluctuations.
How IMARC Pricing Database Can Help
The latest IMARC Group study, "Petroleum Coke Prices, Trend, Chart, Demand, Market Analysis, News, Historical and Forecast Data 2026 Edition," provides a detailed analysis of petroleum coke pricing and global market dynamics. The study examines regional price levels, supply-demand conditions, downstream consumption, and the key factors influencing current and future market movements.
The analysis evaluates the relationship between refinery output, crude-oil processing, petroleum coke availability, downstream industrial demand, energy costs, logistics, and international trade. It also helps businesses understand regional pricing differences and assess market conditions for procurement, sourcing, inventory management, and long-term supply planning.
About Us:
IMARC Group is a global management consulting firm that provides a comprehensive suite of services to support market entry and expansion efforts. The company offers detailed market assessments, feasibility studies, regulatory approvals and licensing support, and pricing analysis, including spot pricing and regional price trends. Its expertise spans demand-supply analysis alongside regional insights covering Asia-Pacific, Europe, North America, Latin America, and the Middle East and Africa. IMARC also specializes in competitive landscape evaluations, profiling key market players, and conducting research into market drivers, restraints, and opportunities. IMARC’s data-driven approach helps businesses navigate complex markets with precision and confidence.
Contact us:
IMARC Group
134 N 4th St. Brooklyn, NY 11249, USA
Email: sales@imarcgroup.com
Tel No: (D) +91 120 433 0800
United States: +1-201971-6302
- Managerial Effectiveness!
- Future and Predictions
- Motivatinal / Inspiring
- Fitness and Wellness
- Medical & Health
- Manufacturing
- Education
- Real-Estate
- Food Industry
- Hospitality
- Online Games
- Sports
- Home Services
- Civil Engineering
- Safety and Protection
- Software Products & Services
- Fashion and Jewellery
- Artificial Intelligence
- Entrepreneurship
- Mentoring & Guidance
- Marketing
- Networking
- HR & Recruiting
- Literature
- Shopping
- Career Management & Advancement