

 SkillClick
How to Write a MATLAB Project Report That Gets High Marks
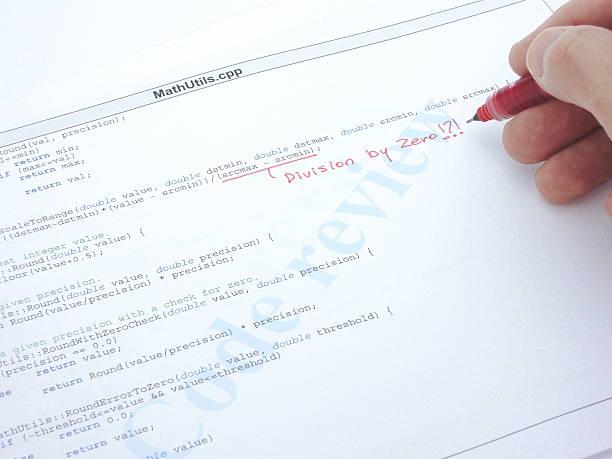
Writing a MATLAB project report can feel like a second assignment after finishing the actual programming. You have already built the model, tested your code and produced graphs, so it is tempting to put everything into a document and call it finished.
That approach usually leaves marks on the table.
A good report should show more than a working MATLAB program. It should make clear what you investigated, why you chose a particular method, what your results mean and how confident you are in them. In engineering and scientific reporting, the results and discussion are particularly important because this is where you demonstrate that you understand the significance of your work rather than simply presenting output.
The good news is that you do not need to make the report unnecessarily complicated. You need a clear line connecting the original problem to your calculations, MATLAB implementation, results and final conclusions.
Start With the Assignment Brief
Before writing anything, I recommend going back to the assignment question and marking scheme.
This is one of the simplest things you can do, yet it is easy to overlook when you are concentrating on the technical side of the project.
Look for exactly what your lecturer is assessing. Depending on the module, this might include:
- Understanding of the underlying theory
- Choice of computational method
- MATLAB implementation
- Accuracy of the results
- Quality of graphs and tables
- Interpretation of results
- Error or uncertainty analysis
- Discussion of limitations
- Quality of the conclusion
- Referencing and presentation
Once you know where the marks are available, structure your report around those requirements.
For example, if the marking scheme gives substantial credit for analysing your results, spending several pages describing basic MATLAB commands is probably not the best use of your word count.
Your report should answer the assessment question, not simply document everything you happened to do while working on the project.
Give the Reader a Clear Introduction
Your introduction should establish the purpose of the project without making the reader work for it.
A useful introduction normally explains the problem, provides enough background to understand it and states what the project is intended to achieve. Engineering-report guidance similarly recommends making the purpose, audience and objectives clear before moving into the technical sections.
For a MATLAB project, you might introduce:
- The engineering or scientific problem
- The mathematical model
- The variables being investigated
- The reason MATLAB is being used
- The main objectives of the project
For example, instead of beginning with:
MATLAB was opened and the following code was written...
you could write:
This project investigates the numerical response of a dynamic system over a specified time interval. MATLAB is used to implement the mathematical model, calculate the system response and compare the numerical results with the expected behaviour.
That gives the reader some context before you start discussing equations and code.
Explain the Mathematics Behind Your MATLAB Code
Your MATLAB code should not have to speak for itself.
A marker should be able to understand the mathematical approach without reverse-engineering your program line by line.
If your project involves an equation such as
dydt=f(t,y),
explain what the variables represent and what conditions are being applied.
You should also explain the method you selected.
For example, if you use a numerical solver, tell the reader what type of problem the solver is intended to handle and why it is appropriate for your particular case. Avoid writing a justification that sounds copied from MATLAB documentation. Explain the decision in the context of your project.
This is also where you should mention important assumptions.
Perhaps your model assumes constant temperature, negligible friction, ideal conditions or a particular boundary condition. Those assumptions can have a direct effect on your final answer, so they deserve to be acknowledged.
The important distinction is this:
The code shows what you did. The methodology explains why you did it.
That distinction can make a major difference to the quality of a technical report.
Explain Your MATLAB Implementation Without Dumping the Code
A common mistake is to fill the methodology section with pages of MATLAB code.
Unless your lecturer specifically asks for a complete listing in the main body, that usually makes the report harder to read.
Instead, describe the workflow.
For example:
- Define the required parameters and constants.
- Enter the mathematical model.
- Apply the initial or boundary conditions.
- Select the numerical method.
- Run the MATLAB program.
- Store and process the calculated values.
- Produce the required graphs.
- Compare the output with a theoretical or reference solution.
- Calculate relevant errors.
You can then include short sections of code where they help explain an important part of the implementation.
For larger programs, put the full listing in an appendix if your assessment rules allow it.
MATLAB's Live Editor can also be useful when documenting computational work because it allows code, output, formatted text, equations and figures to be kept together. MathWorks states that Live Editor documents can be exported in formats including PDF, Word, HTML and LaTeX.
The important point is not to confuse a generated MATLAB document with a finished academic report. You still need to organise and edit the material so that it answers the assignment.
Make Every Graph Earn Its Place
A MATLAB project can produce a lot of graphs.
That does not mean your report needs all of them.
Before inserting a figure, ask yourself:
What does this graph help the reader understand?
A useful figure might show:
- The relationship between two variables
- A change over time
- A comparison between two methods
- The effect of changing a parameter
- Numerical and analytical solutions
- The distribution of an error
- A trend that supports your conclusion
Give each graph a clear title or caption and label the axes properly. Include units wherever they are relevant.
If you are comparing two datasets, make the distinction obvious through appropriate line styles, colours or markers and include a useful legend.
More importantly, discuss the figure in the text.
Do not write:
Figure 3 shows the results.
That tells the reader almost nothing.
Try something more specific:
Figure 3 shows that the numerical solution follows the reference curve closely across most of the investigated range. The difference becomes more noticeable towards the end of the simulation, where the numerical error is largest.
That second version directs the reader towards something worth noticing.
Technical-report guidance from Purdue and Monash likewise recommends introducing figures and explaining the important features rather than expecting the visual alone to communicate the argument.
Present Numbers Clearly
Graphs are useful for showing trends, but sometimes the reader needs the actual numbers.
That is where tables become useful.
Suppose you are comparing a MATLAB result with a theoretical value. A simple table could look like this:
| Test case | MATLAB result | Reference value | Absolute difference |
|---|---|---|---|
| 1 | 0.842 | 0.850 | 0.008 |
| 2 | 1.173 | 1.160 | 0.013 |
| 3 | 1.491 | 1.500 | 0.009 |
The values above are only an example. Your report should contain the results produced by your own project.
Avoid presenting the same information repeatedly. If a table already gives the exact values and a graph adds nothing useful, you may not need both.
Similarly, do not put every intermediate calculation into the main report. Detailed supporting material can often be moved to an appendix, while the main text concentrates on evidence that supports your argument.
Analyse the Results Instead of Just Describing Them
This is probably the biggest difference between an average report and a strong one.
The Results section tells the reader what you found.
The Discussion explains what those findings mean.
Good discussion questions include:
- Did the results behave as expected?
- Do they agree with the mathematical theory?
- How close are they to a reference solution?
- Why might differences have occurred?
- Which variables had the greatest effect?
- What assumptions could have influenced the outcome?
- Are the results reliable within the conditions tested?
For example, imagine your MATLAB simulation gives a slightly different answer from an analytical solution.
Do not simply say:
The MATLAB result was different from the theoretical result.
Explain the difference.
The numerical solution was slightly higher than the analytical result at the end of the simulation. One possible explanation is the accumulation of numerical error during the calculation. The difference is relatively small within the tested range, but increasing the required accuracy or changing the numerical settings could be investigated to determine how sensitive the result is to the computational method.
That is analysis.
Engineering writing guidance consistently emphasises that discussion should interpret results, connect them to the original objectives and consider possible sources of error or limitations.
Use Error Analysis Where It Makes Sense
Avoid describing a result as "accurate" without evidence.
If you have a reference value, quantify the difference.
For example:
Absolute error=∣xMATLAB−xreference∣
and, where appropriate,
Percentage error=∣xMATLAB−xreference∣∣xreference∣×100.
The calculation itself is straightforward. The more important part is interpreting it.
Suppose the percentage difference is 1.5%.
Instead of simply writing:
The error was 1.5%.
explain what that means for the particular project.
For example:
The calculated difference was 1.5%, indicating close agreement between the numerical and reference values for the conditions examined. However, this comparison does not establish that the model is universally accurate because the assessment was limited to the selected parameter range.
That final qualification shows much better technical judgement.
Be Honest About Limitations
No model is perfect.
Your report will usually be stronger if you identify the limitations of your work rather than pretending they do not exist.
Possible limitations include:
- Simplifying assumptions
- Numerical approximation
- Solver settings
- Limited experimental data
- Measurement uncertainty
- Restricted parameter ranges
- Idealised boundary conditions
- Simplifications in the mathematical model
The key is to explain the consequence.
For example:
The model assumes that the damping coefficient remains constant throughout the simulation. In a real system, damping may vary with operating conditions. Consequently, the model may not accurately predict behaviour outside the range considered in this project.
That is much stronger than:
One limitation is that the model is not perfect.
A good discussion does not merely list limitations. It explains how they might affect the results and, where appropriate, how the investigation could be improved.
Make Your Conclusion Answer the Original Question
Your conclusion should bring the report back to its starting point.
Do not introduce a completely new result here.
Instead, briefly explain:
- What the project set out to investigate.
- What the main result was.
- Whether the objective was achieved.
- What the most important limitation was.
- What could be improved in future work.
For example:
The MATLAB model successfully reproduced the expected behaviour of the system over the investigated range. Comparison with the reference solution showed close agreement, although a small difference became apparent under the final test condition. The project objective was therefore achieved within the limitations of the model and numerical approach. Further work could investigate the sensitivity of the solution to solver settings and the assumptions used in the model.
A conclusion should give the reader a clear answer to the question, "So what?" It should not simply repeat the entire Results section.
Keep Your Report Connected From Beginning to End
One useful way to check your report is to follow the chain:
Problem → Theory → Method → MATLAB → Results → Discussion → Conclusion
Each part should lead naturally to the next.
If you introduce a particular project objective, make sure your Results and Discussion return to it.
If you introduce an equation, show how it relates to your MATLAB implementation.
If you include a graph, explain why it matters.
If you report an important number, make it clear where it came from.
This kind of consistency makes the report easier to follow and gives the impression that the work was planned rather than assembled at the last minute.
If you are looking for outside academic support, a matlab assignment writing service can be useful for guidance on structure, explanation or technical presentation, but you should make sure that any assistance remains consistent with your university's academic-integrity rules and that you understand the work you submit.
A Practical Structure for a MATLAB Project Report
If your university has not provided a specific template, a structure like this is a sensible starting point:
1. Title Page
Include the project title and the information required by your university.
2. Abstract or Summary
Briefly explain the problem, method, main result and conclusion.
3. Introduction
Introduce the problem and state the project's objectives.
4. Theory
Explain the relevant equations, concepts and assumptions.
5. Methodology
Describe the MATLAB approach, computational method and important implementation decisions.
6. Results
Present the most important figures, tables and numerical findings.
7. Discussion
Explain what the results mean, compare them with theory or reference values and discuss errors and limitations.
8. Conclusion
Return to the objectives and state what the project demonstrated.
9. References
List the sources you actually used, following the required referencing style.
10. Appendix
Include lengthy code, additional calculations or supporting results where appropriate.
This general arrangement is consistent with common engineering and scientific reporting practices, although your module's instructions should always take precedence.
Do a Final Check Before Submitting
When you think the report is finished, read it as though you were the person marking it.
Check the following:
- Is the project objective obvious?
- Have I explained the important theory?
- Have I justified my computational approach?
- Can someone understand what my MATLAB program does?
- Are my figures labelled correctly?
- Do my tables contain useful information?
- Have I explained the important results?
- Have I quantified differences or errors where appropriate?
- Have I discussed unexpected findings?
- Have I explained meaningful limitations?
- Does the conclusion answer the project objective?
- Are my references complete and consistent?
- Does the submitted MATLAB code produce the results reported in the document?
This final review is often more valuable than adding another page of technical material.
Final Thoughts
A high-quality MATLAB report is not about filling pages with code or producing as many colourful graphs as possible.
It is about showing that you understand the work you have done.
Your MATLAB program produces the computational evidence. Your report explains the reasoning behind it.
The strongest reports therefore make the relationship between the problem, mathematical model, computational method, results and conclusion easy to follow. That is also why technical-report guidance places so much emphasis on interpreting results rather than merely displaying them.
- Managerial Effectiveness!
- Future and Predictions
- Motivatinal / Inspiring
- Fitness and Wellness
- Medical & Health
- Manufacturing
- Education
- Real-Estate
- Food Industry
- Hospitality
- Online Games
- Sports
- Home Services
- Civil Engineering
- Safety and Protection
- Software Products & Services
- Fashion and Jewellery
- Artificial Intelligence
- Entrepreneurship
- Mentoring & Guidance
- Marketing
- Networking
- HR & Recruiting
- Literature
- Shopping
- Career Management & Advancement