

 SkillClick
Stainless Steel Ingot Price Chart 2026: Regional Trends & Outlook
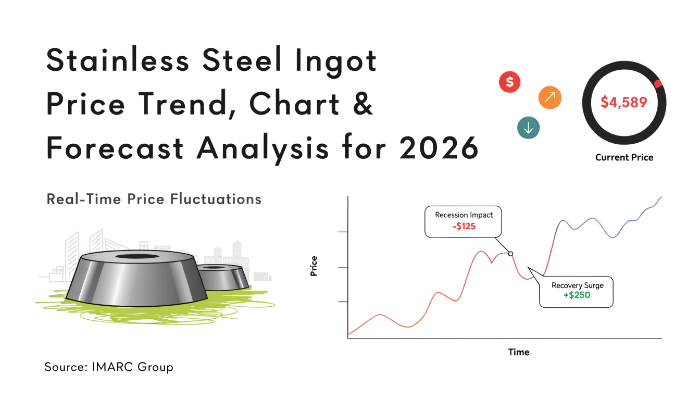
Global Stainless Steel Ingot Price Trends & Outlook – Q2 2026
Stainless Steel Ingot Price Chart in Q2 2026 showed a pronounced regional divergence, with reported benchmarks ranging from USD 1,672/MT in China to USD 4,623/MT in Brazil. The available Q2 dataset does not provide a comparable Q1 figure, so a precise quarter-on-quarter percentage change cannot be stated without introducing unsupported data. The Stainless Steel Ingot price trend was nevertheless shaped by differences in production economics, alloy feedstock costs, energy expenses, freight, and downstream stainless steel demand. IMARC Group’s Q2 2026 price-tracking database places the reported country benchmarks within this broad regional range. Broader steel conditions also remained influenced by expanding production capacity and subdued demand expectations.
Procurement teams can use the Stainless Steel Ingot Price Index 2026 as a structured reference for regional benchmarking and purchasing analysis.
Regional Stainless Steel Ingot Price Snapshot Q2 2026
- Germany: USD 4,208/MT
- USA: USD 4,403/MT
- China: USD 1,672/MT
- Brazil: USD 4,623/MT
- France: USD 4,491/MT
The Q2 2026 figures show a substantial regional cost spread. Brazil recorded the highest supplied benchmark at USD 4,623/MT, while China was lowest at USD 1,672/MT. The USA, France, and Germany were grouped above USD 4,000/MT, indicating considerably higher regional pricing than China. Such differences can reflect variations in energy costs, alloy inputs, production utilization, freight, trade conditions, and downstream purchasing requirements. For procurement managers, the spread reinforces the need to compare delivered costs rather than relying only on headline producer prices.
Q2 2026 Price Analysis: Which Regions Have the Highest Stainless Steel Ingot Prices?
North America: USA Stainless Steel Ingot Price Analysis
The USA benchmark reached USD 4,403/MT in Q2 2026. The comparatively elevated level indicates a higher regional cost base, with domestic production economics, scrap availability, trade measures, and downstream industrial demand influencing procurement conditions.
Asia-Pacific: China Stainless Steel Ingot Price Analysis
China recorded USD 1,672/MT, the lowest among the supplied country benchmarks. The large differential versus the USA and South America indicates strong cost competitiveness, while production capacity, export competition, inventory, and domestic stainless steel consumption remain important supply-demand variables.
South America: Brazil Stainless Steel Ingot Price Analysis
Brazil posted USD 4,623/MT, the highest supplied Q2 benchmark. Higher delivered costs can reflect regional production expenses, imported inputs, logistics, and domestic supply conditions, making supplier diversification and freight evaluation important for buyers.
Stainless Steel Ingot Supply and Demand Overview – Q2 2026
Q2 purchasing conditions were influenced by the balance between stainless steel production, downstream consumption, raw-material availability, and regional logistics. Stainless steel demand from construction, manufacturing, automotive, engineering, and industrial equipment continues to support consumption requirements. India, for example, reported strong finished-steel consumption growth during April–May 2026, demonstrating resilient demand from construction, infrastructure, and manufacturing.
At the same time, capacity expansion can create additional supply pressure. The OECD expects global steelmaking excess capacity to increase substantially through 2028, highlighting the importance of monitoring utilization and production additions when assessing longer-term pricing risk.
Stainless Steel Ingot Price Index & Historical Analysis: What Does Q2 2026 Show?
Stainless Steel Ingot Price Index: How Should Buyers Read Q2 2026?
The Stainless Steel Ingot Price Index provides a framework for comparing pricing across countries and reporting periods. Q2 2026 data indicates a wide geographic dispersion, led by Brazil at USD 4,623/MT and followed by the USA at USD 4,403/MT, while China remained considerably lower at USD 1,672/MT.
Because the supplied dataset does not include Q1 2026 country-level values, a precise Q2-versus-Q1 index percentage cannot be calculated reliably. This avoids presenting an estimated movement as verified pricing data.
Stainless Steel Ingot Price History Chart: How Can It Support Procurement?
A Stainless Steel Ingot price history chart helps procurement teams evaluate whether changes are temporary or part of a longer pricing cycle. Historical analysis is most useful when combined with nickel, ferroalloy, scrap, electricity, freight, inventory, and downstream consumption indicators.
Stainless Steel Ingot Price Forecast 2026: What Is the Next 12-Month Outlook?
Over the next 12 months, pricing is likely to remain sensitive to raw-material costs, energy expenses, stainless steel consumption, freight rates, trade policies, and capacity utilization. The wide Q2 regional spread suggests that country-specific cost structures will continue to play a major role in supplier quotations.
Nickel and ferroalloy movements remain particularly important for stainless steel production economics, while higher electricity and transportation expenses can maintain regional premiums. Recent industry developments also show that scrap availability and freight costs can materially affect stainless steel producers' margins.
For buyers, the Stainless Steel Ingot price forecast 2026 should therefore be treated as a scenario-based planning tool rather than a fixed price assumption.
Key Factors Affecting Stainless Steel Ingot Prices: Quarterly Perspective
- Energy costs: Electric-furnace operations remain sensitive to power prices and can materially alter production economics.
- Nickel and ferroalloys: Changes in nickel, chromium, ferrochrome, and other alloy inputs directly affect stainless steel costs.
- Downstream demand: Construction, automotive, engineering, industrial equipment, and manufacturing activity influence purchasing requirements.
- Freight: Ocean, inland, fuel, and transportation costs affect delivered ingot economics.
- Scrap availability: Stainless scrap is an important feedstock, making availability and collection rates significant pricing variables.
- Trade policies: Tariffs, safeguards, quotas, and import restrictions can alter regional supply balances.
- Production capacity: New capacity can increase availability, while outages or lower utilization can tighten supply.
What Is Stainless Steel Ingot and How Is It Used?
Stainless steel ingot is a cast, semi-finished form of stainless steel produced by melting iron with chromium and other alloying elements such as nickel, molybdenum, and manganese. The resulting ingots can be further processed through forging, rolling, remelting, or other metallurgical operations to manufacture finished and semi-finished stainless steel products.
Its corrosion resistance, strength, durability, and grade flexibility make stainless steel an important material for construction, industrial equipment, automotive applications, processing facilities, and engineering components.
Recent Stainless Steel Ingot Developments: Q2 2026 Highlights
Capacity and trade developments remained important for stainless steel procurement planning. In July 2026, SAIL and Indonesia’s Krakatau Steel announced plans for a joint stainless steel slab facility with proposed annual capacity of 500,000 metric tons, with the project intended to improve access to nickel and strengthen supply integration.
European producers also faced higher scrap, freight, fuel, and transportation costs during Q2, while tighter EU trade measures altered import conditions. These developments indicate that future pricing will depend not only on stainless steel consumption but also on regional capacity, raw-material security, and changing trade flows.
FAQs About Stainless Steel Ingot Prices Q2 2026
What Were Stainless Steel Ingot Prices in Q2 2026?
The supplied Q2 2026 benchmarks ranged from USD 1,672/MT in China to USD 4,623/MT in Brazil. The USA, France, and Germany were all above USD 4,000/MT.
What Does the Stainless Steel Ingot Price Index 2026 Show?
The Stainless Steel Ingot Price Index 2026 highlights substantial regional price differences. Q2 data shows China at USD 1,672/MT compared with Brazil at USD 4,623/MT, demonstrating a significant geographic pricing gap.
Where Can Buyers Track the Stainless Steel Ingot Price Chart?
Buyers can use the Stainless Steel Ingot Price Chart to assess benchmark movements and regional differences. It is most effective when evaluated alongside raw-material, freight, energy, trade, and demand indicators.
How IMARC Group Helps with Stainless Steel Ingot Procurement Planning
IMARC Group provides reliable pricing intelligence to help procurement teams track regional benchmarks, historical pricing, and cost differences. The Q2 2026 data shows a significant gap between China and the higher-priced regions, helping buyers compare suppliers, plan budgets, and negotiate contracts more effectively. Going forward, procurement teams should monitor nickel, ferroalloy, scrap, energy, freight, capacity, and trade conditions, as these factors are likely to influence regional stainless steel ingot prices over the next 12 months.
Explore pricing coverage across 500+ commodities: https://www.imarcgroup.com/pricing-market-reports
Contact Us:
IMARC Group
134 N 4th St., Brooklyn, NY 11249, USA
Email: sales[@]imarcgroup.com
Tel No:(D) +91 120 433 0800
United States: +1-201971-6302
- Managerial Effectiveness!
- Future and Predictions
- Motivatinal / Inspiring
- Fitness and Wellness
- Medical & Health
- Manufacturing
- Education
- Real-Estate
- Food Industry
- Hospitality
- Online Games
- Sports
- Home Services
- Civil Engineering
- Safety and Protection
- Software Products & Services
- Fashion and Jewellery
- Artificial Intelligence
- Entrepreneurship
- Mentoring & Guidance
- Marketing
- Networking
- HR & Recruiting
- Literature
- Shopping
- Career Management & Advancement