

 SkillClick
Calcium Sulfate Price Trend Surges 4.2% in Q2 2026 | IMARC Group
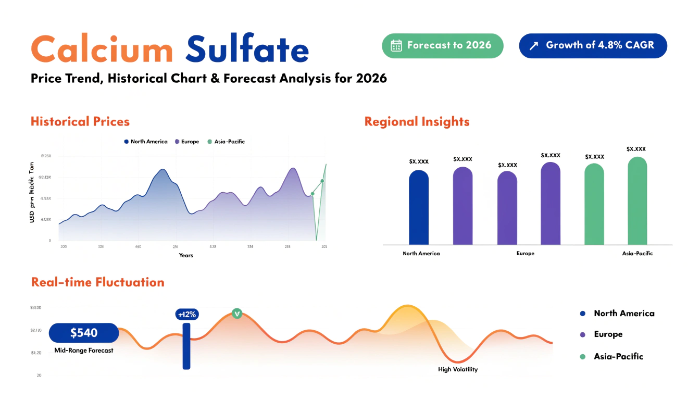
Global Calcium Sulfate Price Trends & Updated – Q2 2026
Calcium Sulfate Price Trend analysis indicates a moderate upward trajectory of approximately 4.2% quarter-on-quarter in Q2 2026, supported by stable construction demand and tightening gypsum feedstock availability. Buyers tracking the Calcium Sulfate Price Forecast observed stronger pricing momentum in Asia-Pacific, while Europe remained cost-competitive due to surplus supply.
Data referenced in this report is aligned with IMARC Group’s Q2 2026 price-tracking database, reflecting transactional-level insights across key global markets. Overall, pricing remained resilient despite mixed industrial demand, supported by fertilizers, cement additives, and drywall applications.
Regional Calcium Sulfate Price Snapshot: Where Did Prices Stand in Q2 2026?
- France: USD 298/MT
- Japan: USD 482/MT
- Germany: USD 204/MT
- Canada: USD 273/MT
- Argentina: USD 243/MT
The global price spread highlights significant regional cost variation driven by logistics, energy input costs, and downstream demand strength. Japan recorded the highest price due to import dependency and higher processing costs, while Germany remained the lowest-cost region amid stable supply. The gap reflects localized supply-demand imbalances rather than structural global shortages.
Calcium Sulfate Price Analysis: Regional Performance Breakdown Q2 2026
North America (USA)
Pricing in North America remained steady around the mid-range, closely aligned with Canada at USD 273/MT. The region saw stable demand from construction and agriculture, particularly gypsum-based soil conditioners. Supply chains remained efficient, limiting volatility, though freight costs created minor upward pressure.
Asia-Pacific (Japan, India, China)
Asia-Pacific recorded the strongest pricing environment, led by Japan at USD 482/MT. High import reliance and strong demand from infrastructure projects contributed to elevated prices. China maintained stable output levels, while India saw balanced demand from fertilizers and cement blending. Overall, the region experienced upward pricing momentum.
South America (Brazil)
South America, represented by Argentina at USD 243/MT, reflected moderate pricing supported by agricultural demand. Fertilizer applications, especially soil conditioning, remained a key driver. However, currency fluctuations and logistics constraints limited stronger price gains.
Supply and Demand Overview – Q2 2026
Supply conditions in Q2 2026 remained largely stable, supported by consistent gypsum mining output and synthetic gypsum production from flue gas desulfurization (FGD) processes. However, localized disruptions in mining operations and environmental compliance measures tightened availability in certain regions.
On the demand side, construction remained the dominant consumption driver, particularly in Asia-Pacific and North America. Cement and drywall manufacturing sustained baseline demand, while agriculture contributed incremental growth through soil amendment applications.
Industrial demand from chemical processing sectors remained moderate, preventing excessive price spikes. Overall, the balance between supply stability and steady demand growth supported a controlled price increase rather than sharp volatility.
Calcium Sulfate Price Index & Historical Analysis
The Calcium Sulfate Price Index in Q2 2026 showed a consistent upward movement compared to Q1 2026, reflecting improved demand visibility and cost stabilization. The index increased by approximately 4–5% quarter-on-quarter, marking a recovery phase after a relatively flat Q1.
Historically, price movements have been closely linked to construction cycles and energy input costs. Compared to the previous year, prices remained within a moderate growth band, indicating a stable long-term trend. The Calcium Sulfate price history chart suggests that while short-term fluctuations occur due to regional factors, the broader trajectory remains tied to infrastructure and agricultural demand cycles.
Calcium Sulfate Price Chart 2026: How Did Prices Move Quarter to Quarter?
The Calcium Sulfate Price Chart for 2026 shows a gradual upward slope from Q1 to Q2, with minimal volatility spikes. This reflects a well-balanced supply chain and predictable demand patterns.
Quarterly movement analysis indicates:
- Q1 2026: Stable baseline pricing
- Q2 2026: Gradual increase driven by demand recovery
- No sharp corrections or supply shocks observed
This pattern is particularly relevant for procurement teams planning long-term contracts, as it signals a predictable pricing environment.
Calcium Sulfate Forecast – Next 12 Months
The Calcium Sulfate price forecast 2026 suggests a continued moderate uptrend over the next 12 months, with expected growth in the range of 3–6%.
Key expectations:
- Asia-Pacific to remain the highest-priced region due to sustained demand
- North America to maintain stable mid-range pricing
- Europe likely to remain cost-competitive unless supply tightens
Seasonal construction activity and fertilizer demand cycles will influence short-term fluctuations. However, no major supply disruptions are anticipated, indicating a stable pricing outlook.
Key Factors Affecting Calcium Sulfate Prices: Quarterly Perspective
Several factors influenced pricing dynamics in Q2 2026:
Energy Costs:
Production and processing costs are sensitive to energy prices. Stable energy costs helped maintain predictable pricing.
Chlor-Alkali and Industrial Demand:
Industrial applications contributed moderate demand, supporting baseline consumption.
Freight and Logistics:
Shipping costs impacted regional price differences, particularly in import-dependent markets like Japan.
Raw Material Availability:
Natural gypsum supply and synthetic gypsum production levels played a critical role in price stability.
Construction Sector Activity:
Infrastructure and real estate development remained the primary demand drivers globally.
What Is Calcium Sulfate?
Calcium sulfate is an inorganic compound commonly found in natural mineral form as gypsum. It is widely used across industries due to its versatility and cost-effectiveness.
Key applications include:
- Construction: drywall, plaster, and cement additives
- Agriculture: soil conditioning and fertilizer blending
- Industrial: fillers, desiccants, and chemical processing
Its demand is closely tied to construction and agricultural cycles, making it a critical commodity for procurement teams in these sectors.
Recent Developments (Q2 Highlights)
- Increased adoption of synthetic gypsum from FGD processes improved supply stability
- Infrastructure investments in Asia-Pacific supported demand growth
- Environmental regulations impacted mining operations in certain regions
- Freight normalization reduced volatility in international pricing
- Strategic supplier contracts helped stabilize long-term procurement costs
These developments collectively contributed to a balanced pricing environment in Q2 2026.
FAQs About Calcium Sulfate Pricing Insights & Trend Analysis:
What Is The Calcium Sulfate Price Index In Q2 2026?
The Calcium Sulfate Price Index increased by approximately 4–5% compared to Q1 2026. This reflects steady demand recovery and stable supply conditions across major regions.
How Does The Calcium Sulfate Price Chart Reflect Market Trends?
The Calcium Sulfate Price Chart for 2026 shows a gradual upward trend without sharp volatility. This indicates a balanced supply-demand environment and predictable pricing conditions.
What Is The Outlook for the Calcium Sulfate Price Forecast 2026?
The Calcium Sulfate price forecast 2026 indicates moderate growth of 3–6% over the next year. Demand from construction and agriculture will remain the primary drivers of this trend.
How IMARC Helps
IMARC Group provides validated pricing intelligence backed by its Q2 2026 price-tracking database, helping procurement teams monitor calcium sulfate price movements with accuracy. The current trend reflects stable growth supported by consistent demand fundamentals.
Looking ahead, buyers can expect a controlled upward trajectory, making strategic sourcing and long-term contracts essential for cost optimization.
Access Comprehensive Pricing Intelligence Reports: https://www.imarcgroup.com/pricing-market-reports
Contact Us:
IMARC Group
134 N 4th St., Brooklyn, NY 11249, USA
Email: sales[@]imarcgroup.com
Tel No:(D) +91 120 433 0800
United States: +1-201971-6302
- Managerial Effectiveness!
- Future and Predictions
- Motivatinal / Inspiring
- Fitness and Wellness
- Medical & Health
- Manufacturing
- Education
- Real-Estate
- Food Industry
- Hospitality
- Online Games
- Sports
- Home Services
- Civil Engineering
- Safety and Protection
- Software Products & Services
- Fashion and Jewellery
- Artificial Intelligence
- Entrepreneurship
- Mentoring & Guidance
- Marketing
- Networking
- HR & Recruiting
- Literature
- Shopping
- Career Management & Advancement